Transmission Electron Microscope (TEM)
I participated in two projects involving TEM (JEOL-2100F), which is the MXene and the Metal-Organic-Framework (MOF) project.
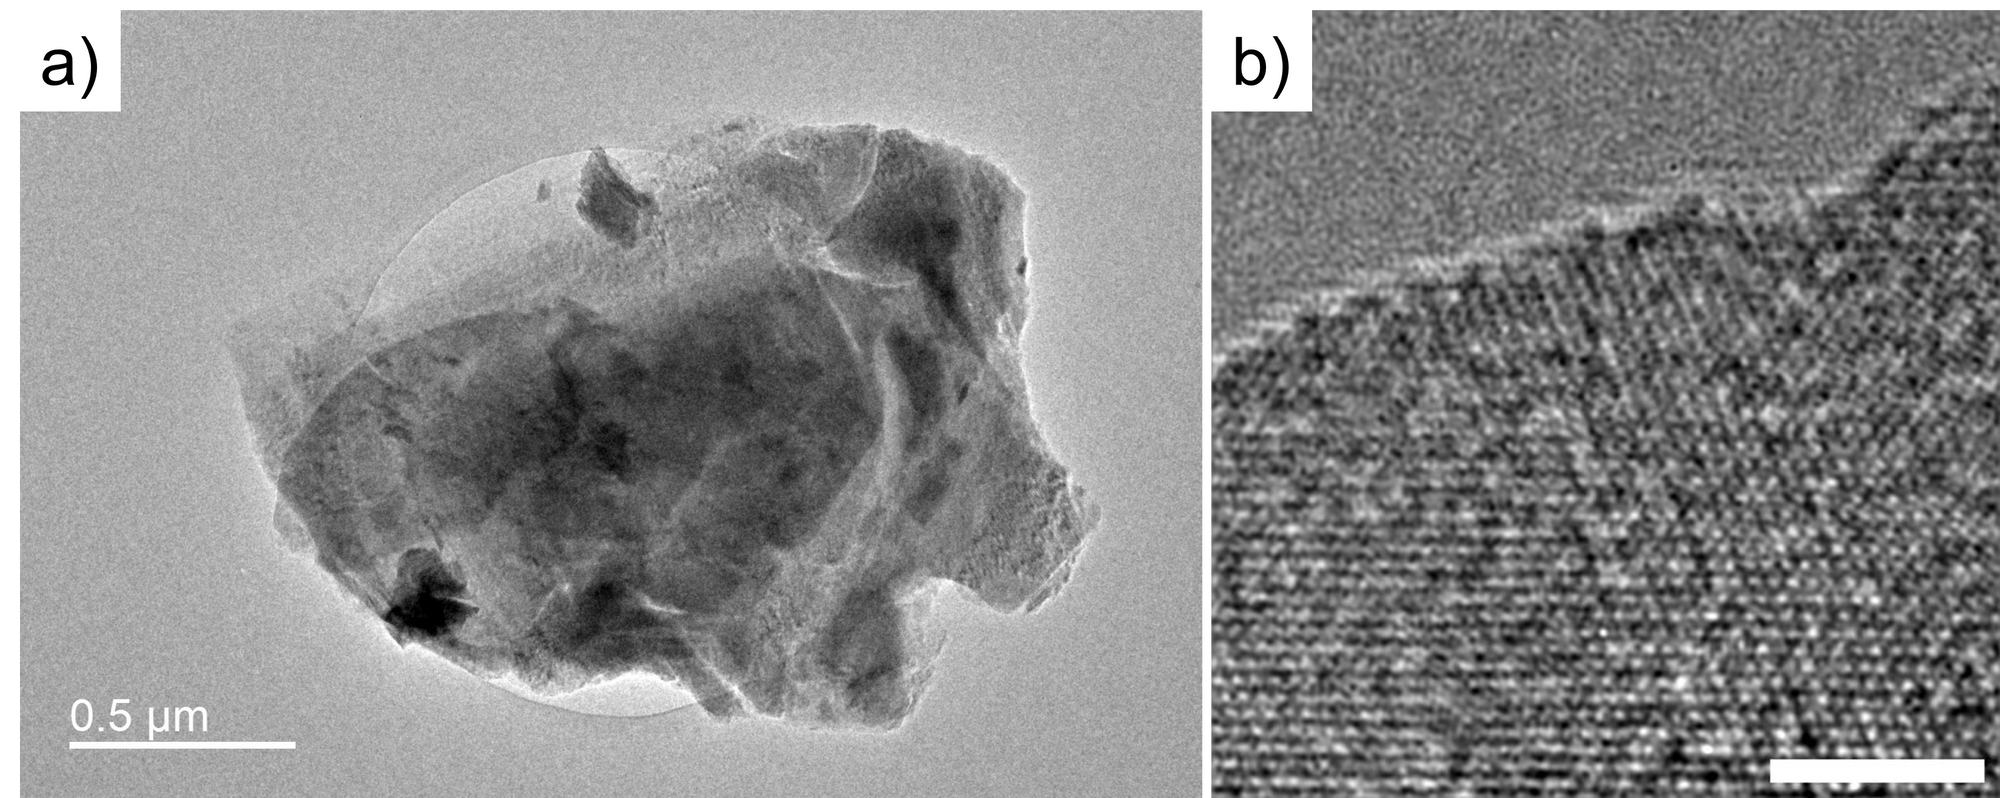
Starting from the MXene project, I used TEM to examine MXene at the atomic scale. Figure 1a shows the TEM image of the MXene I synthesized and exfoliated. It can be observed that it is a multilayer MXene, only a portion of the area is thin enough for TEM. Figure 1b shows the HRTEM image of MXene, it shows the lattice of the MXene at (001) direction.
Moreover, I captured the cross-section image of MXene. However, the MXene synthesis is dangerous because it involves HF. I gave up on this project.
For the MOF project, my role was to synthesize various MOF and confirm their size and crystallinity. If the crystal was good enough, it will be examined by another TEM (Spectra 300). Because the lower current on Spectra 300 reduced the damage of the electron beam to the MOF sample.
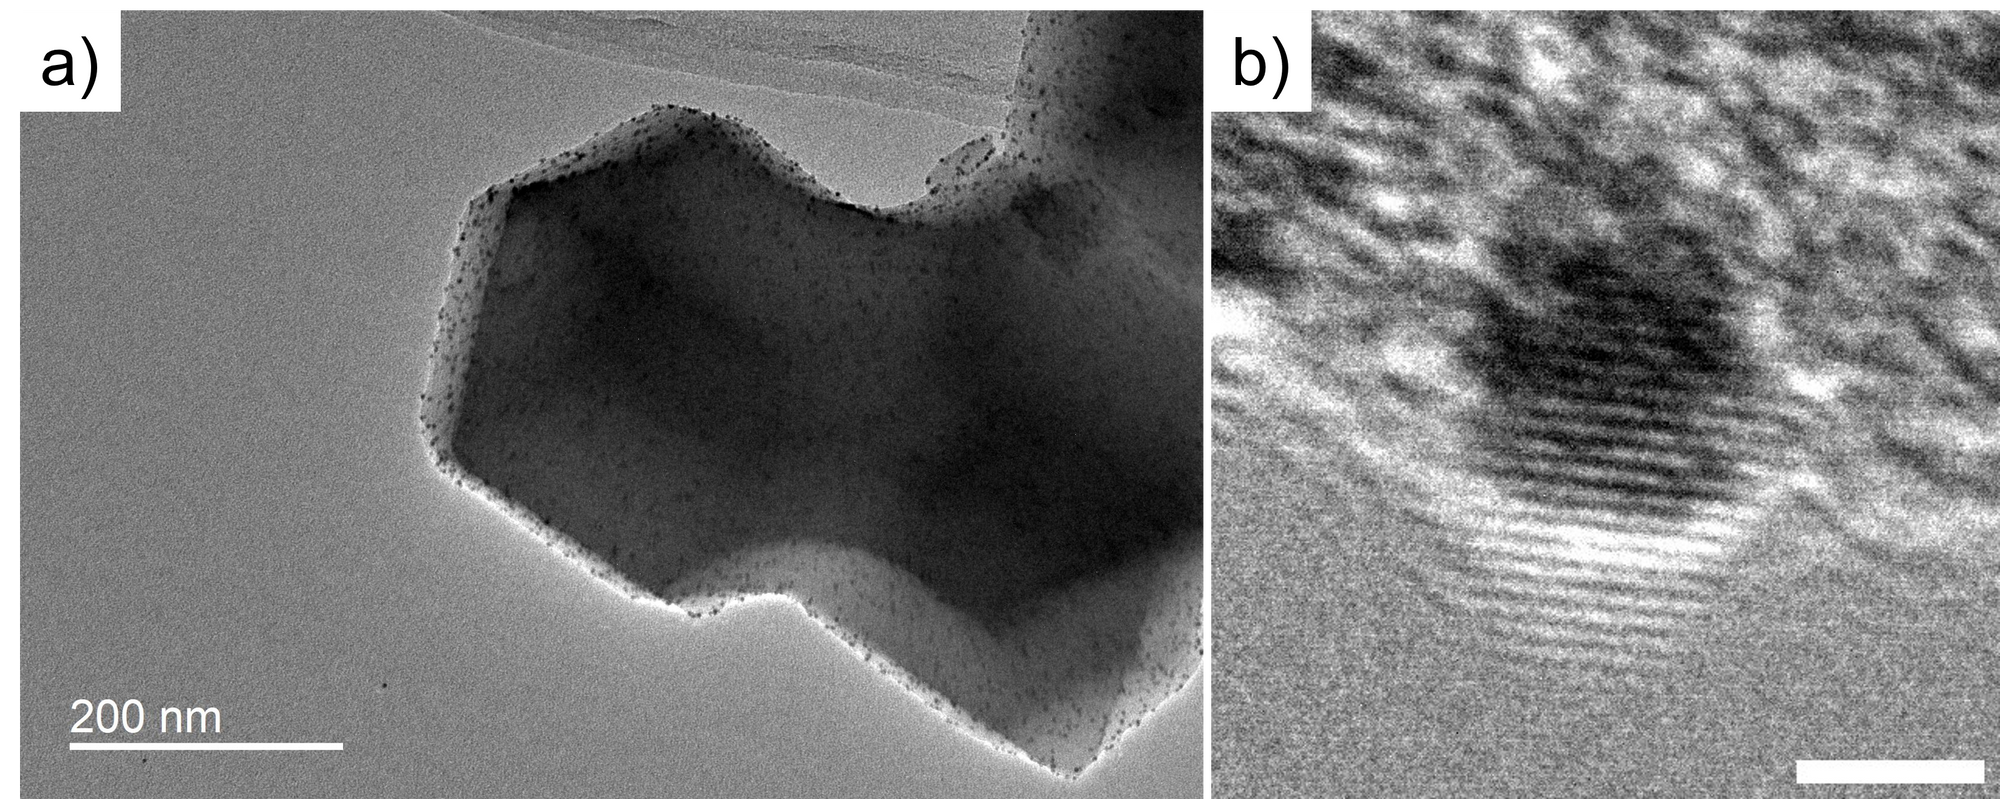
Figure 3 shows the TEM and HRTEM image of the Pt-doped ZIF8@ZIF67 core-shell structure. The crystal at ~200nm size is the ZIF8@ZIF67, and the black dot distributed in ZIF8@ZIF67 is the Pt nanoparticle. In the HRTEM, we can see the lattice fringe of the Pt nano-particle but cannot see the lattice of ZIF8@ZIF67. It is because the MOF sample is sensitive to the electron beam, therefore, the crystal was damaged. In contrast, the Pt nano-particle is stable to electron beam irradiation.
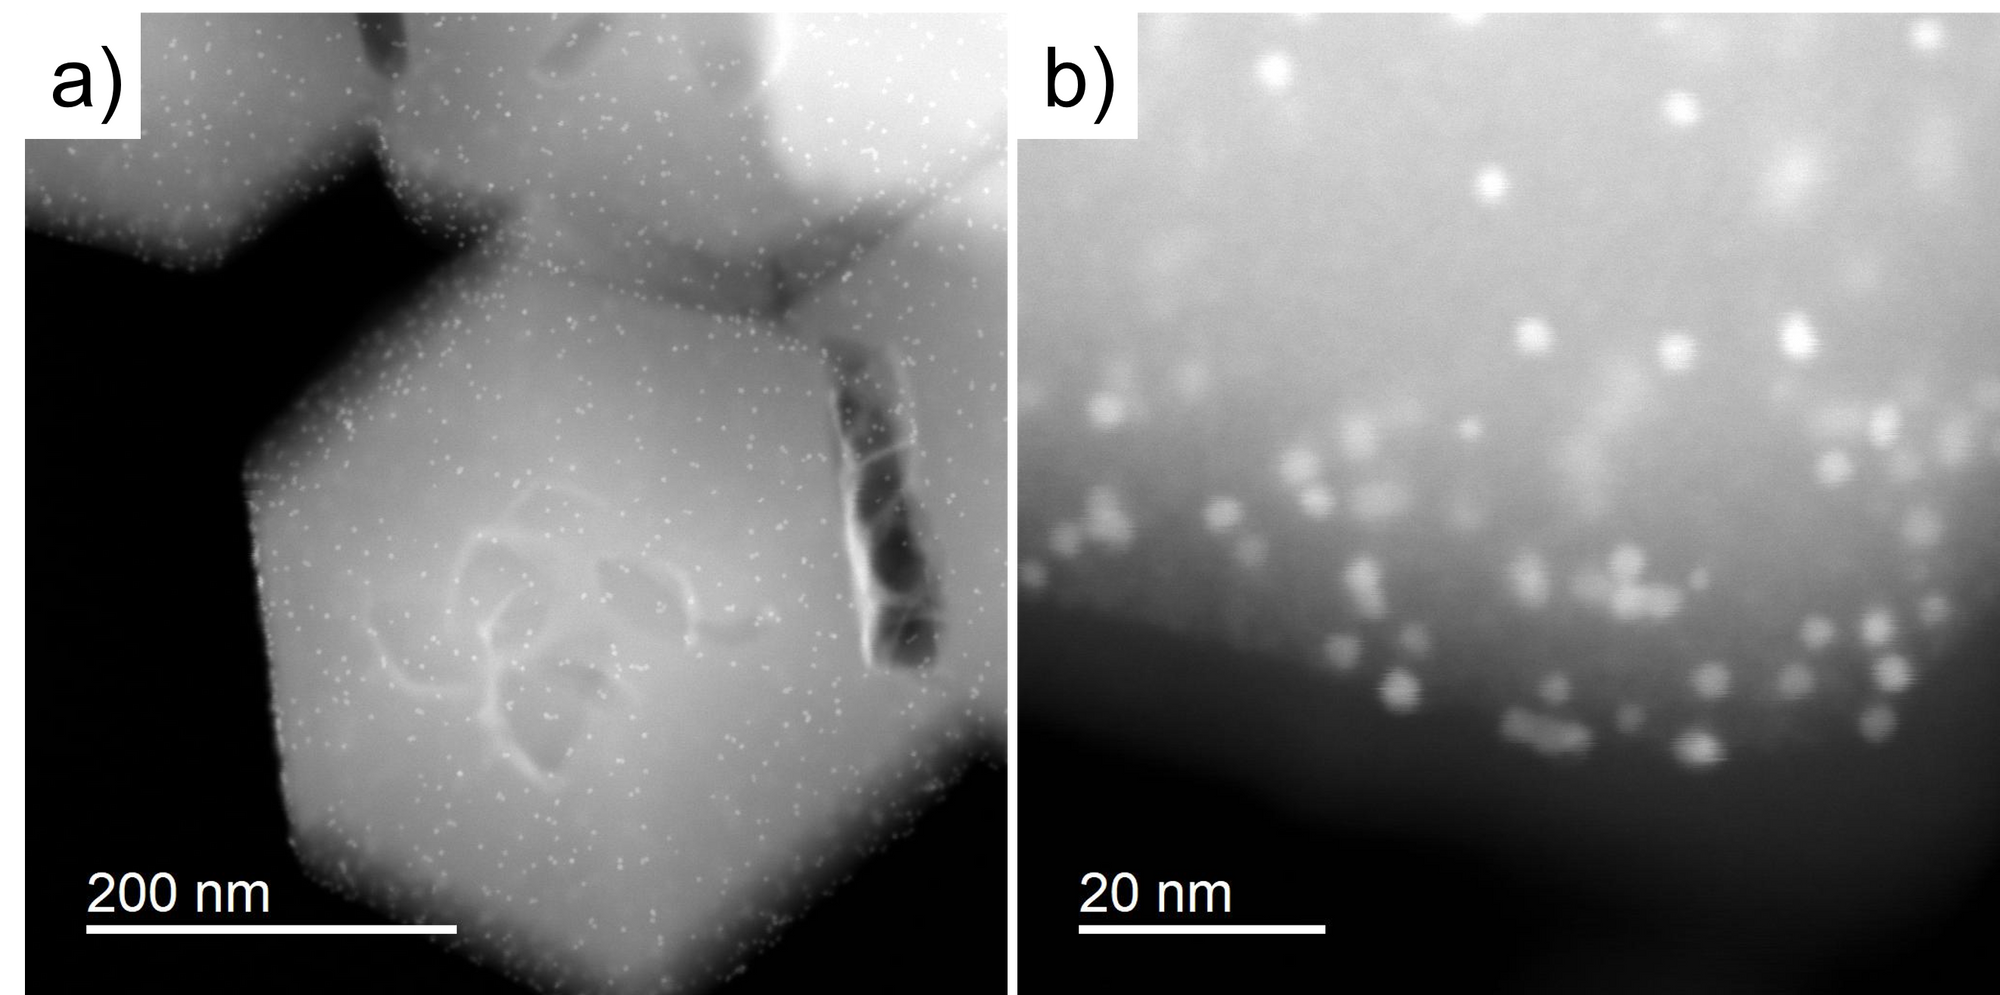
If we capture the image in STEM mode, we can see the contrast difference between the MOF and Pt. It is because the intensity of STEM image is the function of the atomic number. The higher atomic number induces higher intensity.
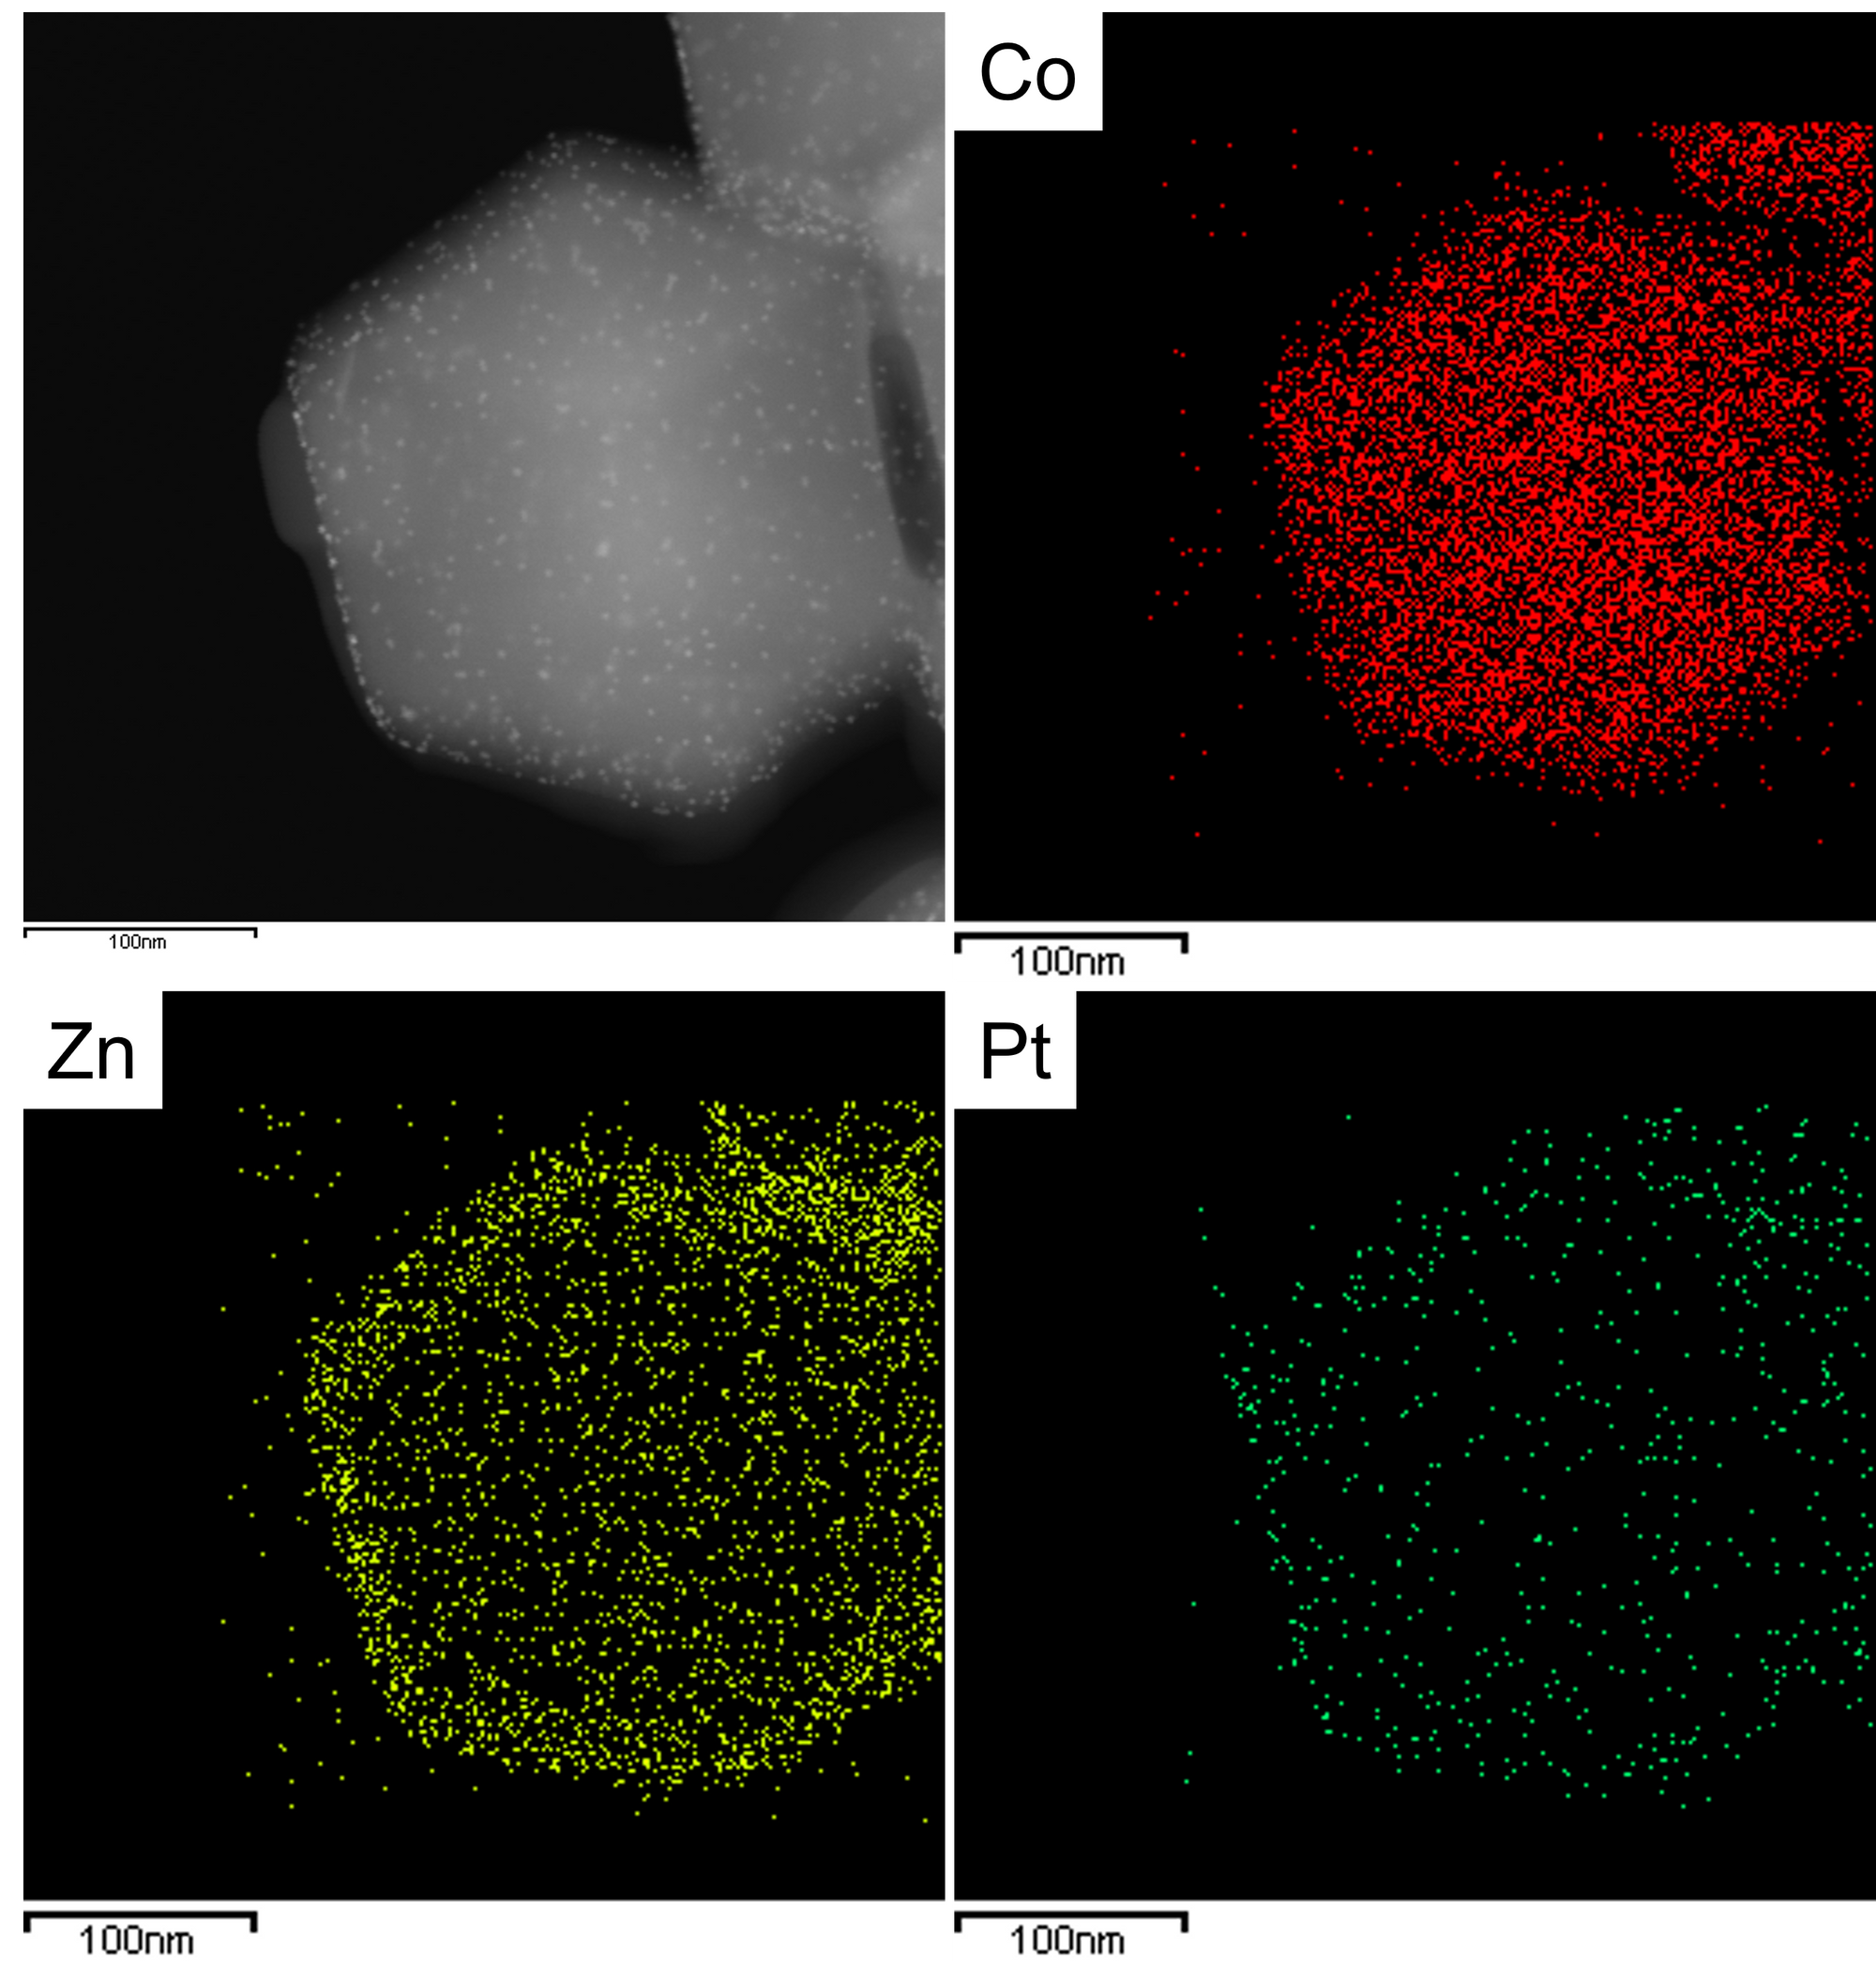
We can examine the Pt-doped ZIF8@ZIF67 using the EDS technique. We can see the core-shell structure and the Pt element here.